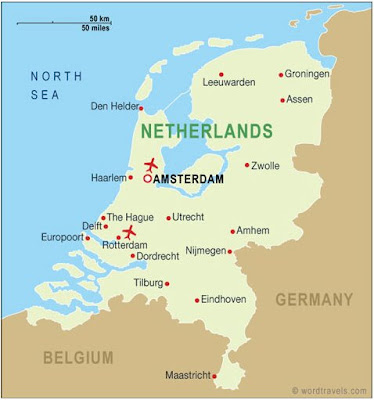
Background:
The Dutch United Provinces declared their independence from Spain in 1579; during the 17th century, they became a leading seafaring and commercial power, with settlements and colonies around the world. After a 20-year French occupation, a Kingdom of the Netherlands was formed in 1815. In 1830 Belgium seceded and formed a separate kingdom. The Netherlands remained neutral in World War I, but suffered invasion and occupation by Germany in World War II. A modern, industrialized nation, the Netherlands is also a large exporter of agricultural products. The country was a founding member of NATO and the EEC (now the EU), and participated in the introduction of the euro in 1999.Location:
Western Europe, bordering the North Sea, between Belgium and GermanyArea:
total: 41,526 sq km {Malaysia = 329,750 sq km}land: 33,883 sq km
water: 7,643 sq km
Climate:
temperate; marine; cool summers and mild wintersTerrain:
mostly coastal lowland and reclaimed land (polders); some hills in southeastPopulation:
16,645,313 (July 2008 est.) {Malaysia = 25,274,132}Age structure:
0-14 years: 17.6% (male 1,496,348/female 1,427,297){Malaysia = 31.8% (male 4,135,013/female 3,898,761) }
15-64 years: 67.8% (male 5,705,003/female 5,583,787)
{Malaysia = 63.3% (male 8,026,755/female 7,965,332) }
65 years and over: 14.6% (male 1,040,932/female 1,391,946) (2008 est.)
{Malaysia = 4.9% (male 548,970/female 699,302) }
Ethnic groups:
Dutch 80.7%, EU 5%, Indonesian 2.4%, Turkish 2.2%, Surinamese 2%, Moroccan 2%, Netherlands Antilles & Aruba 0.8%, other 4.8% (2008 est.){Malaysia = Malay 50.4%, Chinese 23.7%, indigenous 11%, Indian 7.1%, others 7.8%}
Religions:
Roman Catholic 30%, Dutch Reformed 11%, Calvinist 6%, other Protestant 3%, Muslim 5.8%, other 2.2%, none 42% (2006){Malaysia = Muslim 60.4%, Buddhist 19.2%, Christian 9.1%, Hindu 6.3%, Confucianism, Taoism, other traditional Chinese religions 2.6%, other or unknown 1.5%, none 0.8%}
Climate
The predominant wind direction in the Netherlands is south-west, which causes a moderate maritime climate, with cool summers and mild winters. The following tables are based on mean measurements by the KNMI weather station in De Bilt between 1971 and 2000:
| Month | Jan | Feb | Mar | Apr | May | Jun | Jul | Aug | Sep | Oct | Nov | Dec | Year |
|---|---|---|---|---|---|---|---|---|---|---|---|---|---|
Avg. maximum temp. (°C) | 5.2 | 6.1 | 9.6 | 12.9 | 17.6 | 19.8 | 22.1 | 22.3 | 18.7 | 14.2 | 9.1 | 6.4 | 13.7 |
Avg. minimum temp. (°C) | 0.0 | -0.1 | 2.0 | 3.5 | 7.5 | 10.2 | 12.5 | 12.0 | 9.6 | 6.5 | 3.2 | 1.3 | 5.7 |


